
Anderson’s model of faulting, Moray Coast
What is Anderson’s model ?
Scottish geologist Ernest Anderson (1877 - 1960) is known for his work on the dynamics of faulting captured in “the Dynamics of Faulting and Dyke Formation with Applications to Britain” in 1951. His model, commonly known as Anderson’s model by geologists, predicts…
3 types of faults based upon relative movement of the hanging wall - normal, reverse and strike-slip,
60° dip for normal faults, 30° dip for reverse faults and 90° dip for strike-slip faults.

Fault classification based upon relative movement of hanging wall to footwall. Thicker red arrows mean higher value of principle stress.
What about crossing faults that look like an X
Its very common to see a pair of faults that cross each other. These are called conjugate faults which are also predicted by Anderson’s model. So, we can define these as a pair of faults of common origin but they dip in the opposite direction. Each of the 3 fault types above can form conjugate sets.
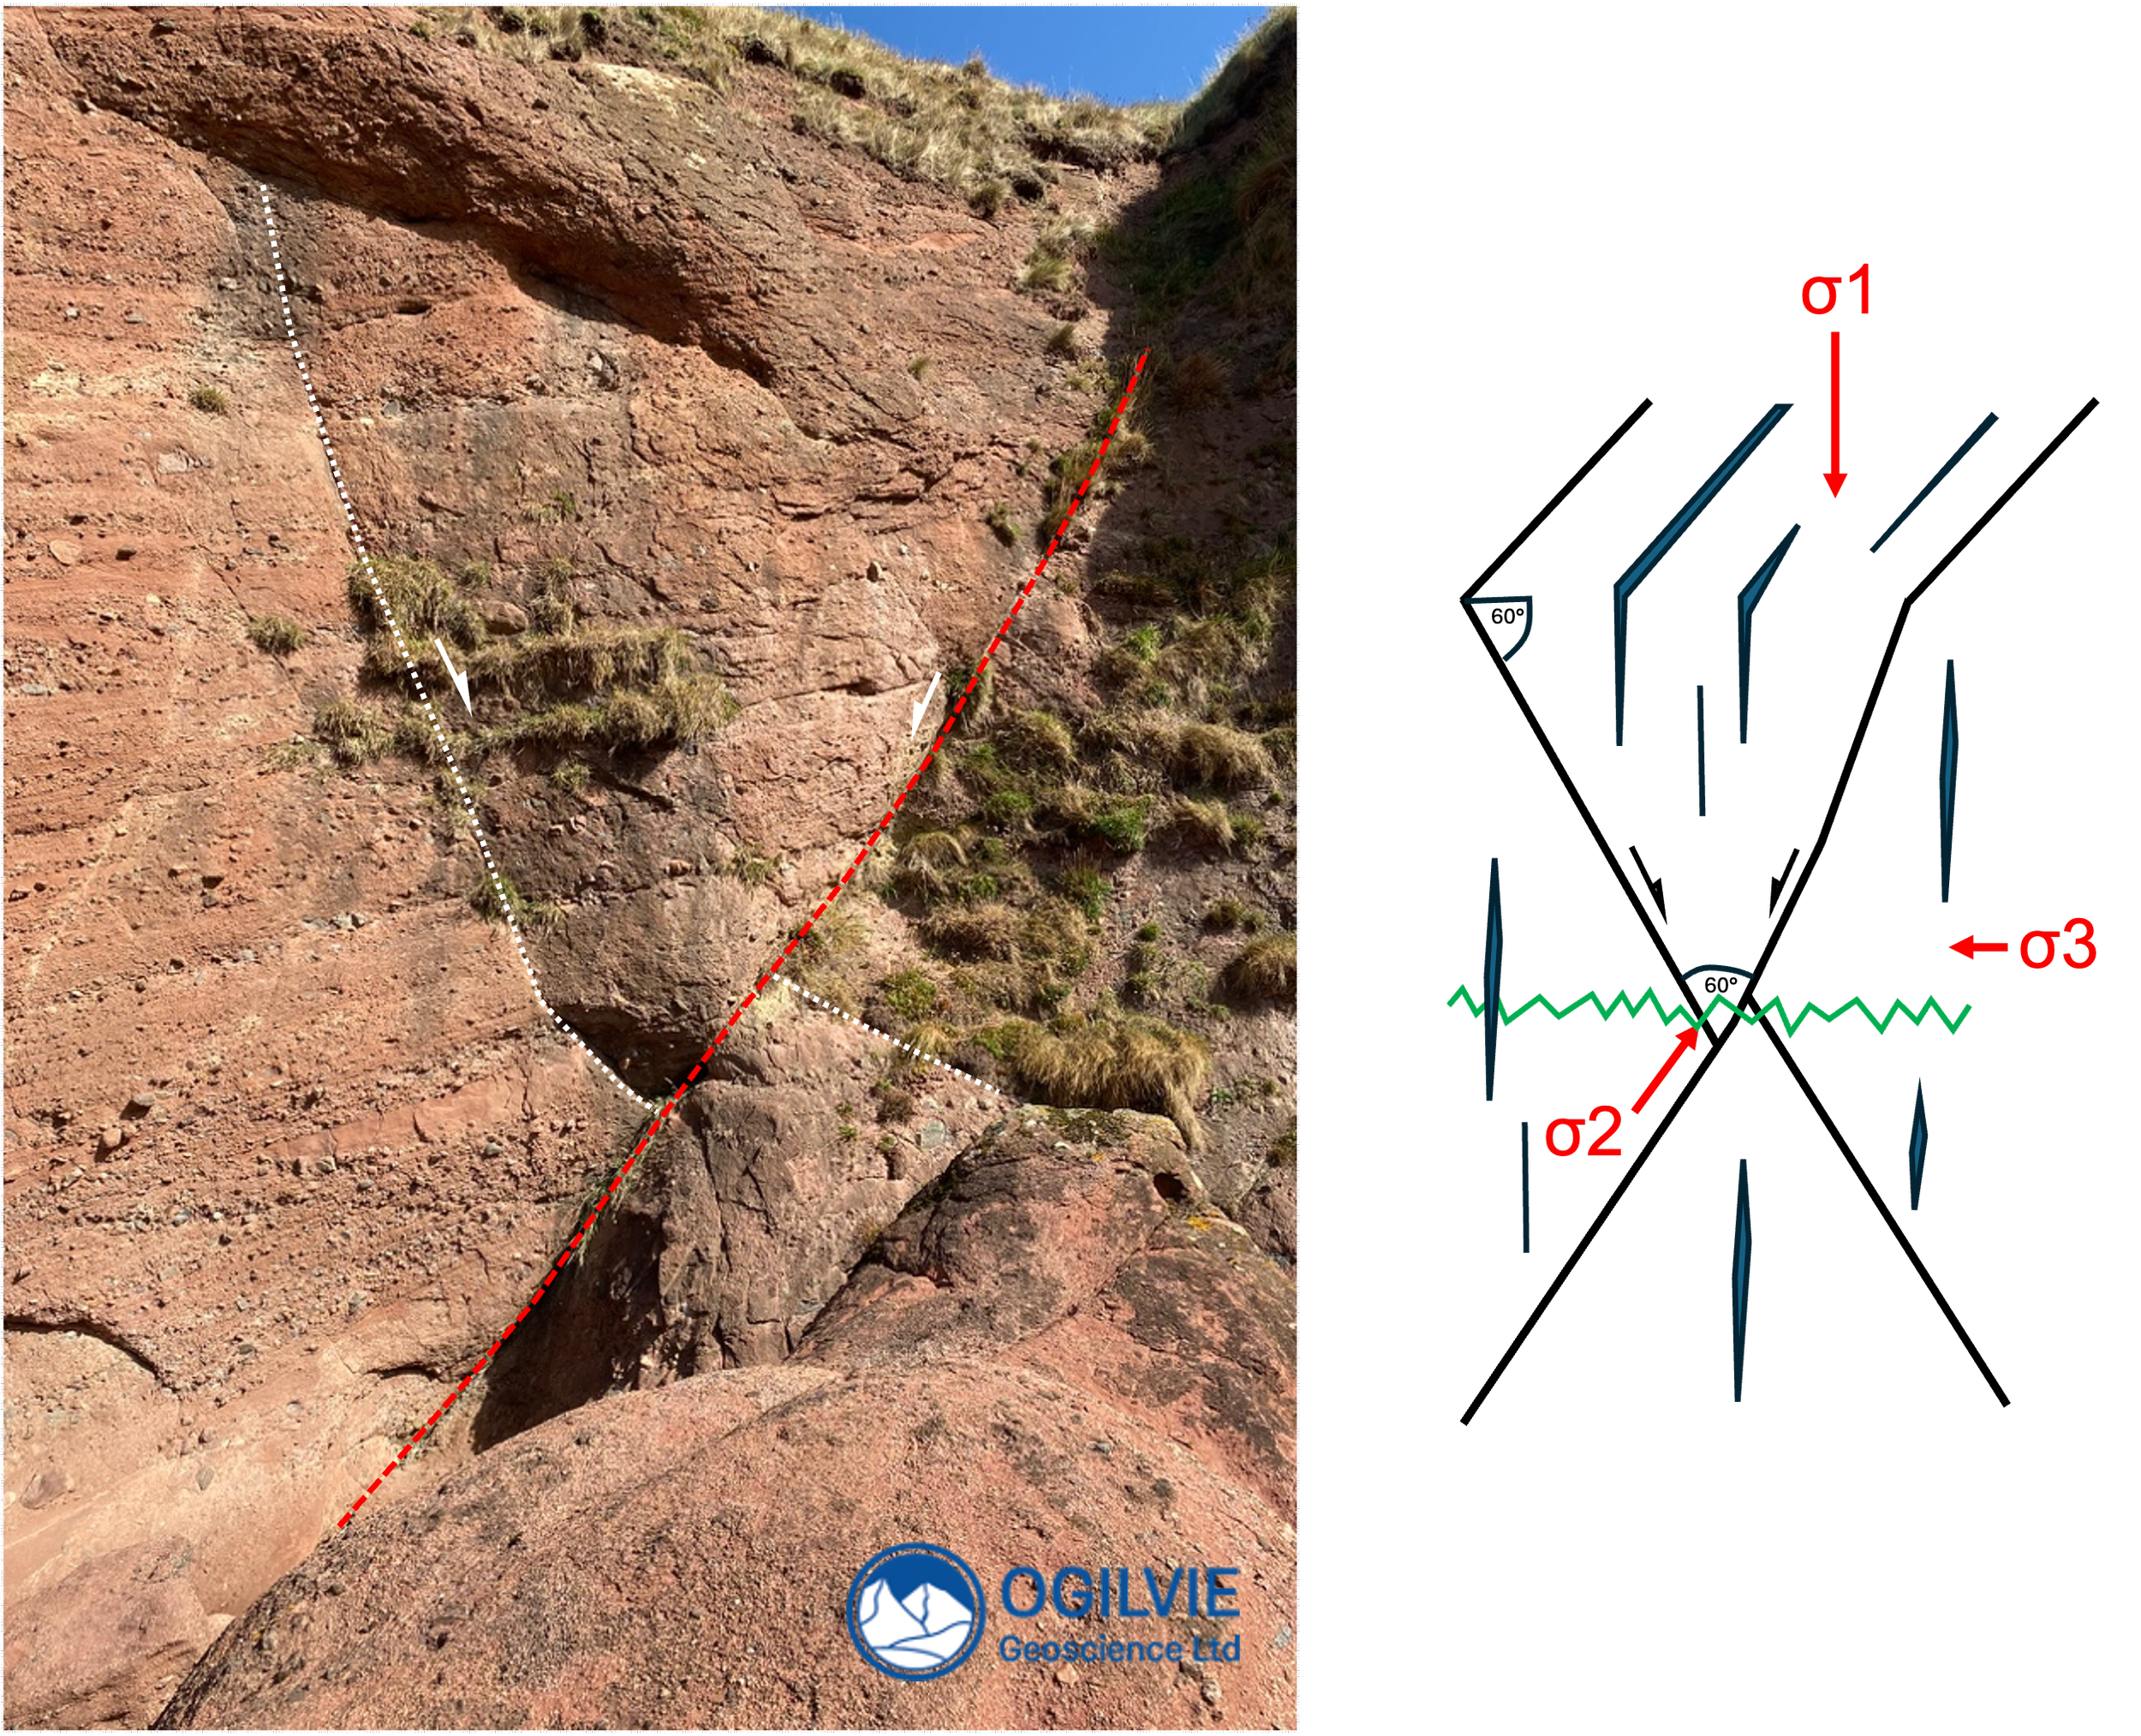
A local example (to me) is a conjugate set of normal faults in the Permian age Hopeman Sandstone on the Scottish Moray coast. Note that both faults dip at 60°, one to the north and the other to the South. They are separated by a 60° angle. Cross-cutting relations show us that the left dipping fault is younger than the right dipping fault, so these are not conjugate faults in the true sense. In fact these faults are zones of deformation bands - note the wider compound zone in the foreground.

Facing East along a zone of crossing faults in outcrop (Hopeman Sandstone, UK). Note compound zone of deformation bands (dashed line) in the foreground. Anderson’s model shown on the right.
Another example from further (eastwards) along this coast at New Aberdour is shown below. This time, the sandstones are pebbly (fluvial) sandstones from the Old Red Sandstone. Again, both faults dip at roughly 60°. The red fault is clearly younger then the white one.
Conjugate set of normal faults in the Old Red Sandstone at New Aberdour, Morayshire, Scotland
What about interpreting seismic data ?
It’s important to bring Anderson’s model to the fore of any seismic interpretation. For example if a normal fault does not have a 60° dip then it must have been rotated or there is a mechanical explanation (plane of weakness). The latter is because the Anderson model does not predict low angle faults - which may initiate due to a pre-existing anisotropy such as a weak salt layer.
Key Takeaways
Faults are usually classified on the basis on relative movement of the hanging wall to the footwall, into (i) normal, (ii) reverse and (iii) strike slip faults.
Anderson’s model also predicts a 60° dip for normal faults, 30° dip for reverse faults and 90° dip for strike slip faults.
All of these fault types can display conjugate geometries as illustrated by normal faults in outcrop here. Not only do normal faults initiate at 60° but the 2 faults are separated by 60°.
Anderson’s model does not predict low angle (<< 60°), therefore low angle faults interpreted on seismic must have have a structural geological explanation e.g., rotation.